

User guide5 min
The site overview
Where a site opens: a score out of 100, what changed since the last scan, and a card for each audit area explaining the number.
The score#
A site with no failing checks scores 100.
Passing checks cost nothing. If your score is below 100, there is a specific list of reasons, and this screen shows all of them. There is no baseline deduction and no hidden component.
app.pixyscan.com/w/…/s/…
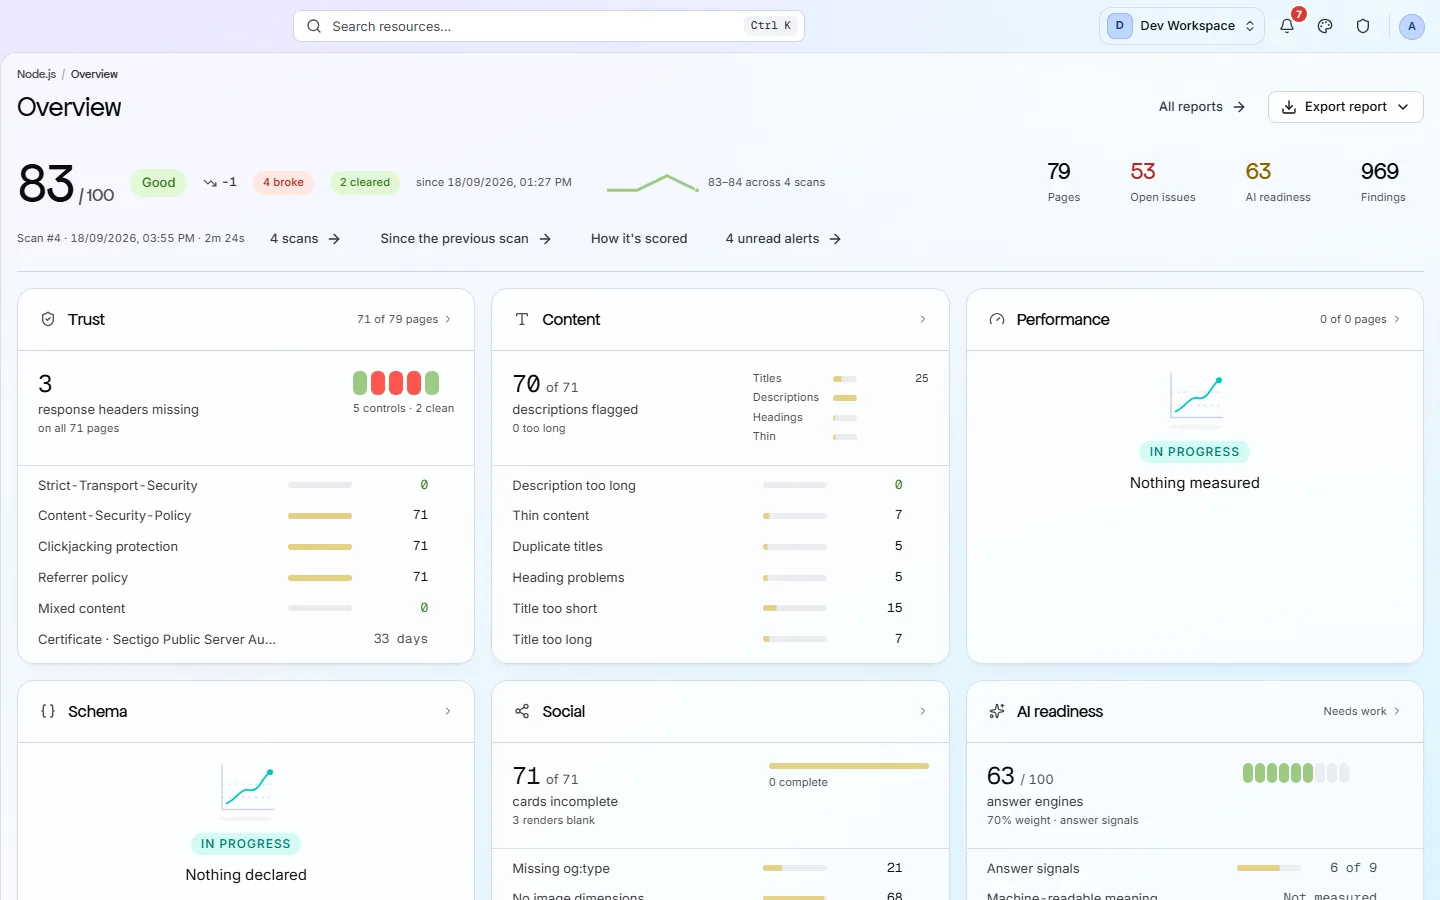
| Field | Example | What it does |
|---|---|---|
| Score | 83 / 100 | This scan's health score. |
| Band | Good | A word for the range the score falls in, so you do not have to interpret the number. |
| Delta | −1 | The change since the previous scan of the same branch. A first scan says “First scan” instead of showing a zero. |
| broke / cleared | 4 broke · 2 cleared | Checks that started failing, and checks that stopped, since the previous scan. |
| Trend | 83-84 across 4 scans | A small chart of recent scores, with its range written out. |
| Counts | Pages · Open issues · AI readiness · Findings | Four figures, each linking to the screen it comes from. |
How a failed check affects the score#
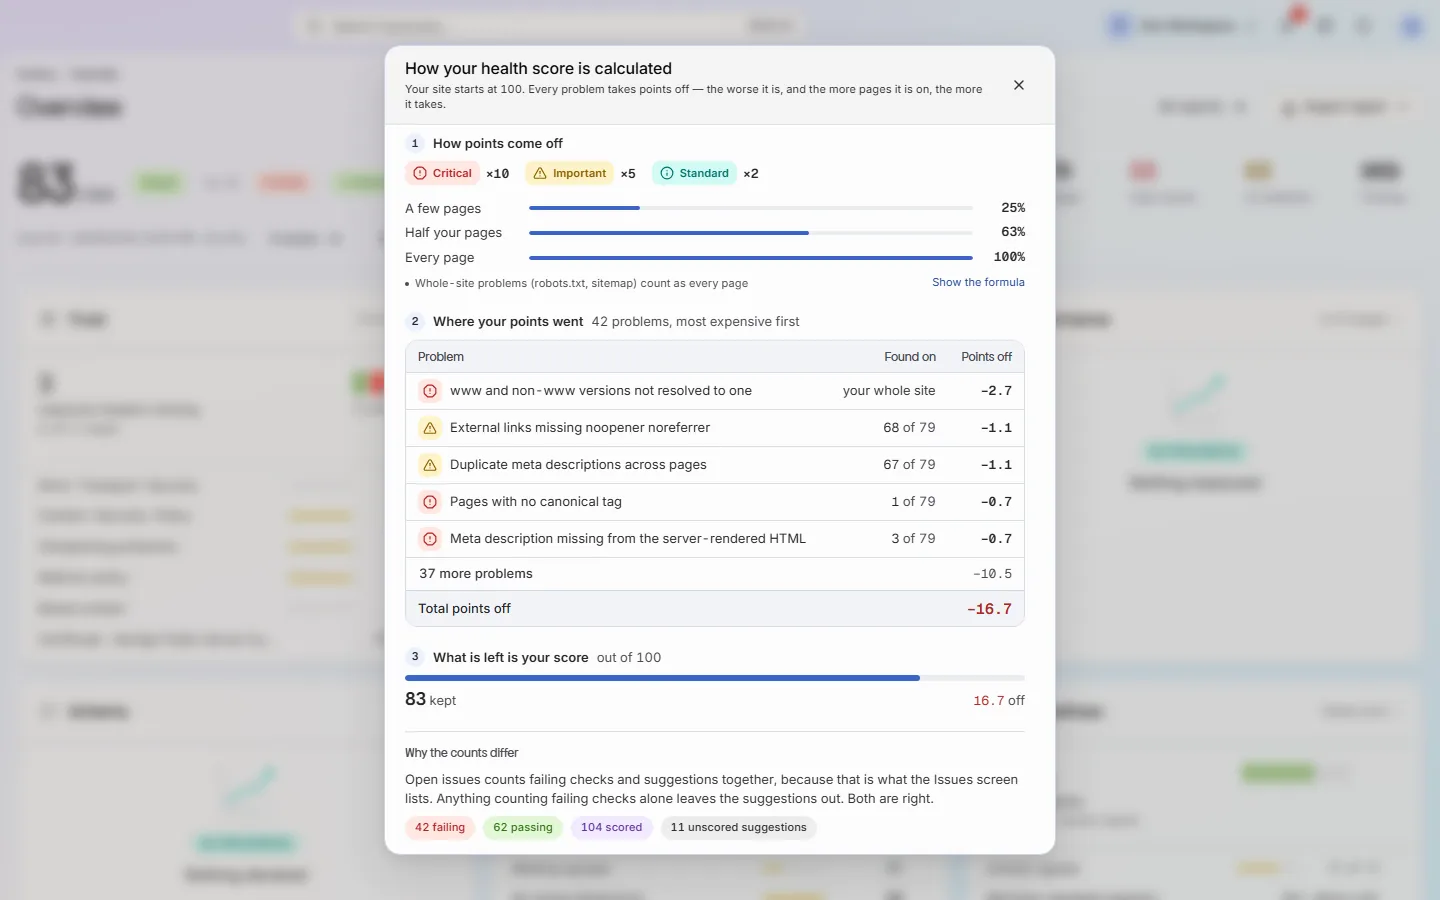
Severity sets the weight, and how many pages it affects scales it.
| Field | Weight | What it does |
|---|---|---|
| Critical | 10 | Something that stops a page being found, indexed or trusted. |
| Important | 5 | Something that weakens a page without breaking it. |
| Standard | 2 | A small problem, worth fixing when you are editing the page anyway. |
| Suggestion | 0 | Advice only. It appears in the list but costs nothing, so a site can ignore every suggestion and still score 100. |
That weight is then scaled by how many of your crawled pages the failure appears on. One mistake in a shared template affects every page and costs accordingly; the same mistake on a single page costs much less.
How it's scored
The full formula is published
The row of links below the score#
Four shortcuts to related screens.
| Field | Goes to | What it does |
|---|---|---|
| N scans | Scan history | Every scan this site has run. |
| Since the previous scan | Changes | What this scan changed compared with the last one. |
| How it's scored | A dialog | Every problem making up the score, with the points each one costs. |
| N unread alerts | Site alerts | Events raised for this site. |
A card per audit area#
Trust, Content, Performance, Schema, Social and AI readiness, each summarising one Explore screen.
Each card shows a headline figure and the two or three worst problems behind it, and clicking it opens the full screen. Trust shows missing response headers and when your certificate expires; Content shows how many descriptions are flagged; Social shows how many cards are incomplete. A card with nothing to show says so rather than showing a zero.
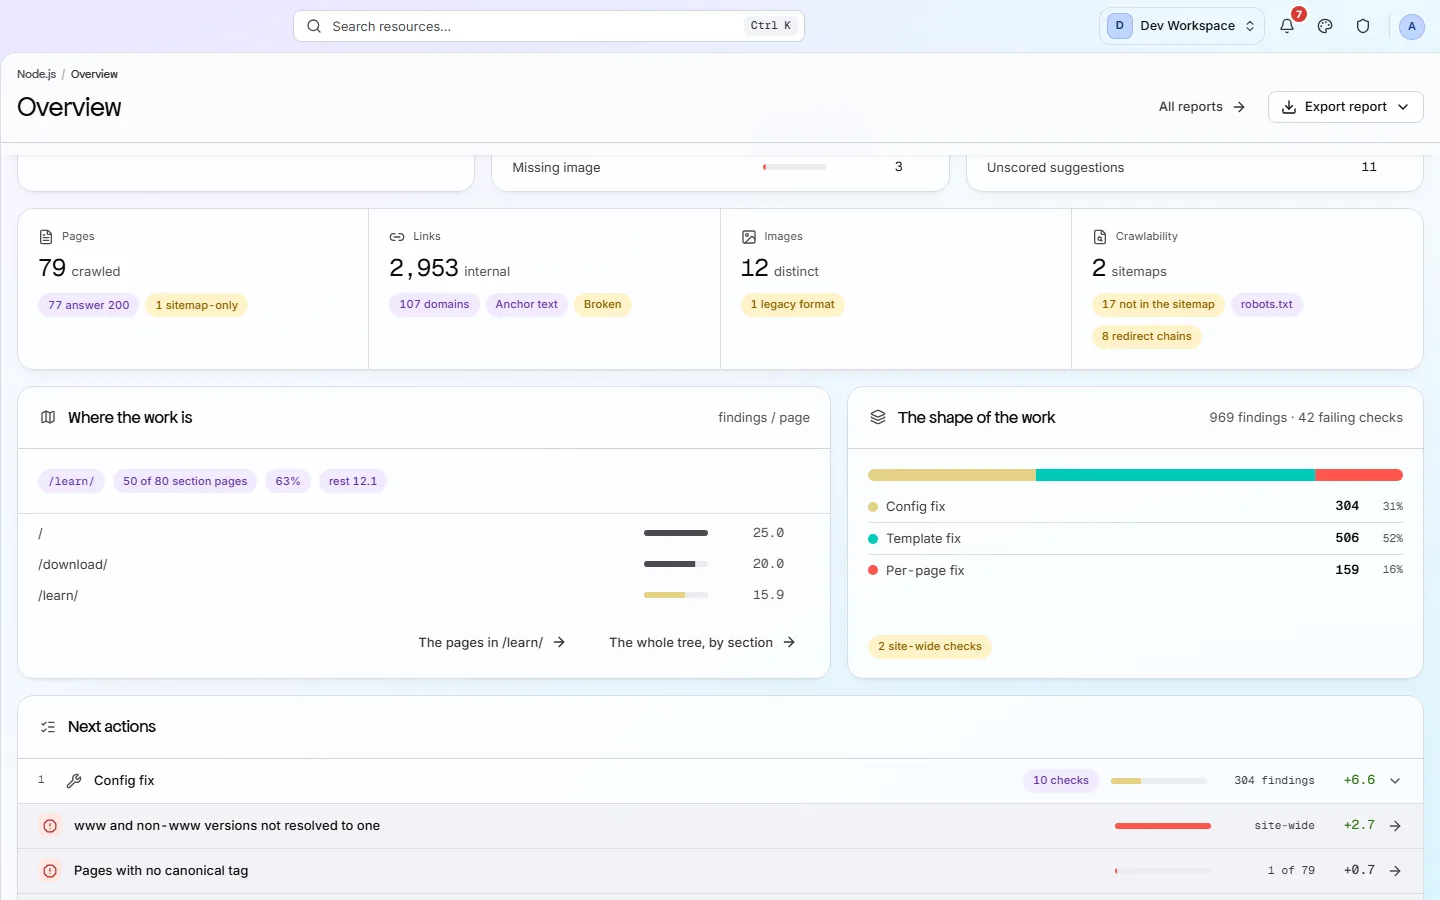
Lower on the same screen
Do not compare scores between sites
If the product does not match this page, the page is wrong and we would like to know. Tell us