

Find the pages that make visitors wait
Slow pages lose visitors and rank lower. The Performance view times every page the scan visits, lists every script, stylesheet and font your pages load, and, with your own Google API key, shows Google's Core Web Vitals.
- views of speed
- 4
- views of speed
- where a page counts as slow
- 3 s
- where a page counts as slow
- Core Web Vitals shown
- 4
- Core Web Vitals shown
What it shows you
Four ways to see your speed
The first two views come from every scan on every plan. The last two use Google's own tools.
Load times
How long each page took to load when the scan visited it. You get the median, the time 9 in 10 pages load within, and the slowest page.
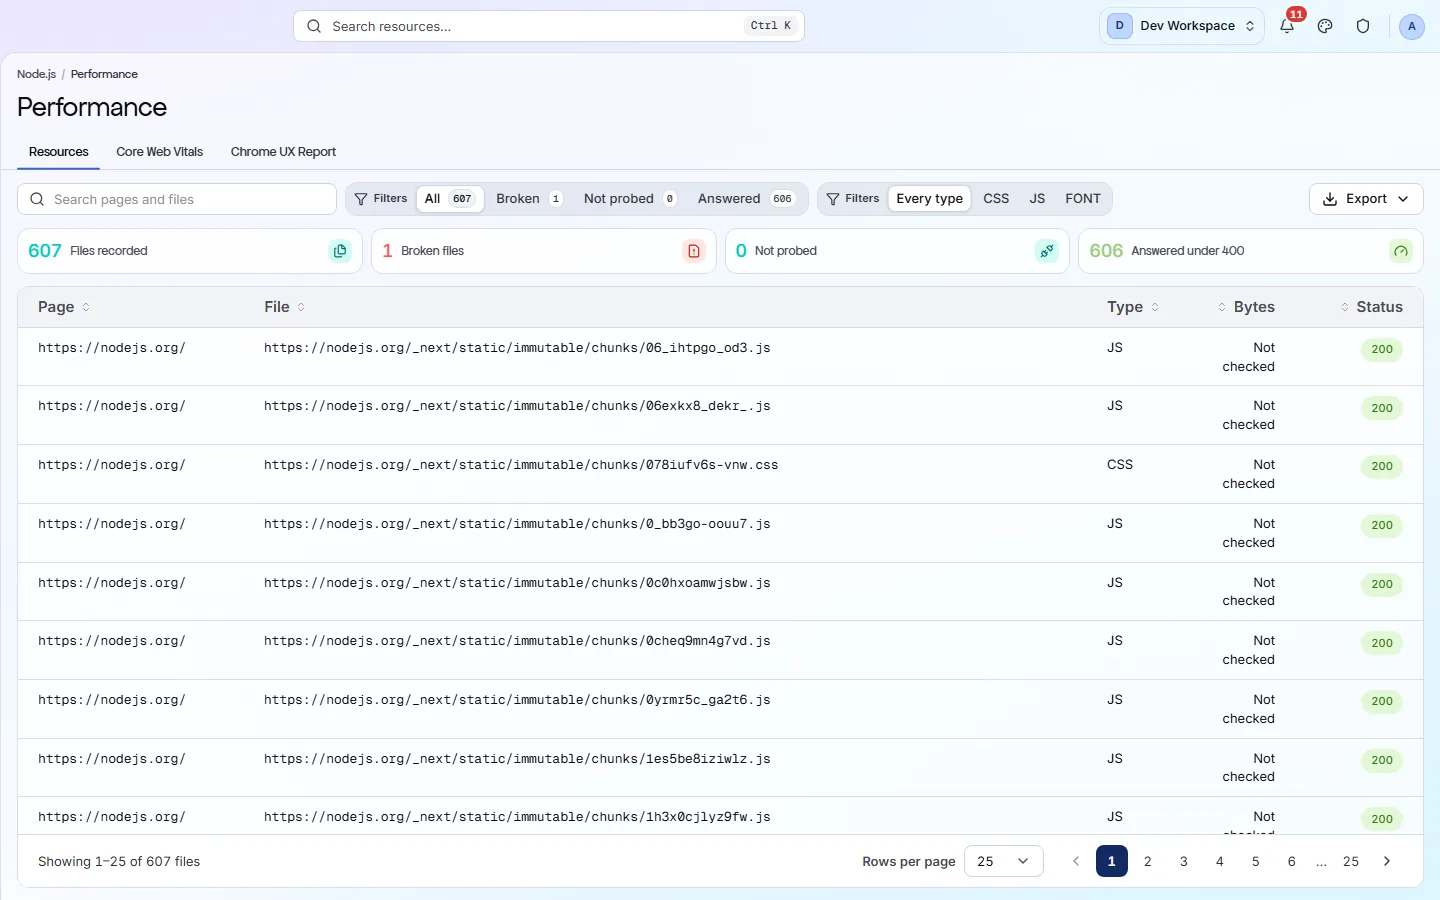
Resources
Every stylesheet, script and font your pages load, with its size and status. Broken files are counted, so a missing script never goes unnoticed.
Core Web Vitals
Google's speed and stability scores for a sample of your pages, from PageSpeed Insights. From Hobby up, with your own free Google API key.
Chrome UX Report
What real Chrome visitors experienced over the last 28 days, for your whole site and for each page Google has enough data on.
Core Web Vitals
What the numbers mean, and what is good
These are Google's own limits. The app colours each value good, needs improvement or poor using them.
- LCP
Largest Contentful Paint: how long until the main content, usually the big image or heading, appears.
Good up to 2.5 s · poor over 4 s
- INP
Interaction to Next Paint: how fast the page reacts when someone taps or clicks. Needs real visitors.
Good up to 200 ms · poor over 500 ms
- CLS
Cumulative Layout Shift: how much the page jumps around while it loads.
Good up to 0.1 · poor over 0.25
- TTFB
Time to First Byte: how long your server takes to start answering.
Good up to 800 ms · poor over 1.8 s
- Load time
PixyScan's own timing of every page during the scan, from navigation to render.
Fast under 1 s · moderate 1–3 s · slow 3 s and over
What it finds
Speed problems and how to fix them
These checks run with Google PageSpeed Insights and appear in the Issues view with the pages they affect.
- Important
The main content loads slowly (poor LCP)
Visitors stare at an empty page and many leave before it appears.
How to fix: Speed up the server first, then make the main image smaller and never lazy-load it.
- Important
The page jumps while loading (poor CLS)
Buttons move under people's fingers and they click the wrong thing.
How to fix: Give images and videos a
widthandheight, and reserve space for ads, embeds and banners. - Important
The page reacts slowly to taps (poor INP)
The page feels frozen when someone clicks a button or opens a menu.
How to fix: Break long JavaScript tasks into smaller ones, and update the screen before doing heavy work.
- Important
The main image is lazy-loaded
The browser waits to fetch the most important picture on the page.
How to fix: Remove
loading="lazy"from that image and addfetchpriority="high". - Standard
The server is slow to answer (TTFB)
Every other step waits for the first byte, so everything is slower.
How to fix: Cache your HTML and serve it from a CDN close to your visitors.
- Standard
Scripts or styles block the page
The browser stops drawing the page until these files have loaded.
How to fix: Add
deferorasyncto scripts, and inline the CSS the top of the page needs.
Inside the app
Timings and files, from a real scan
Every page timed by the scan, sorted into fast, moderate and slow, slowest first.
Click around: it is a working copy of the screen, filled with our test site's data.
Core Web Vitals need your own Google API key
From Hobby up, add a free Google PageSpeed API key in your workspace or site settings. Each scan then measures the homepage and your most-linked pages. Load times and Resources work on every plan, with no key.
The checks behind this screen
Check categories shown here
These groups of checks feed the numbers on this screen. Each one is explained on the score page.
Delivery & Trust
37 checksThese checks cover HTTPS, SSL certificates (including ones about to expire), outdated TLS versions, security headers, mixed content, compression, render-blocking scripts and page size. On Hobby and above, once you add your own Google API key, they also flag poor Core Web Vitals (Google's measures of loading speed and visual stability) and Lighthouse findings such as unused code, oversized images and short cache times.
FAQ
Common questions about this feature
Why are only some pages measured for Core Web Vitals?
Google's PageSpeed test takes time for each page, so each scan measures a sample: the homepage and the pages your site links to most. Pages outside the sample read “Not measured”, never zero.
Why is INP sometimes not measured?
INP needs real visitors tapping and clicking. When Chrome has no real-user data for a page, only a lab test runs, and INP is left out.
Does this view change my health score?
Not directly. The speed checks behind it, such as poor LCP or render-blocking scripts, are scored in the Issues view under Delivery & Trust.
Can I export the data?
Yes, from Hobby up. Each tab exports its own list, such as timed pages, page files or Core Web Vitals, as CSV, Excel or JSON.
Continue the product tour
Previous and next features
Features follow the order of the app’s menu. See the full list to jump to any of them.
See what is wrong with your site
Add your site and get your score, your to-do list and a fix guide for every problem. Free for one site and 500 pages a month, with no time limit.
Nothing to install · Cancel any time