

User guide3 min
Performance
Three tabs. Resources lists every file your pages load and comes from the crawl. The other two are Google's measurements, and need a PageSpeed key before they show anything.
How to get there#
Explore → Performance.
- 1
Open Performance in the sidebar
After Images.
- 2
Start on Resources
It always has data. The other two need an API key - see the warning below.
app.pixyscan.com/w/…/s/…/performance
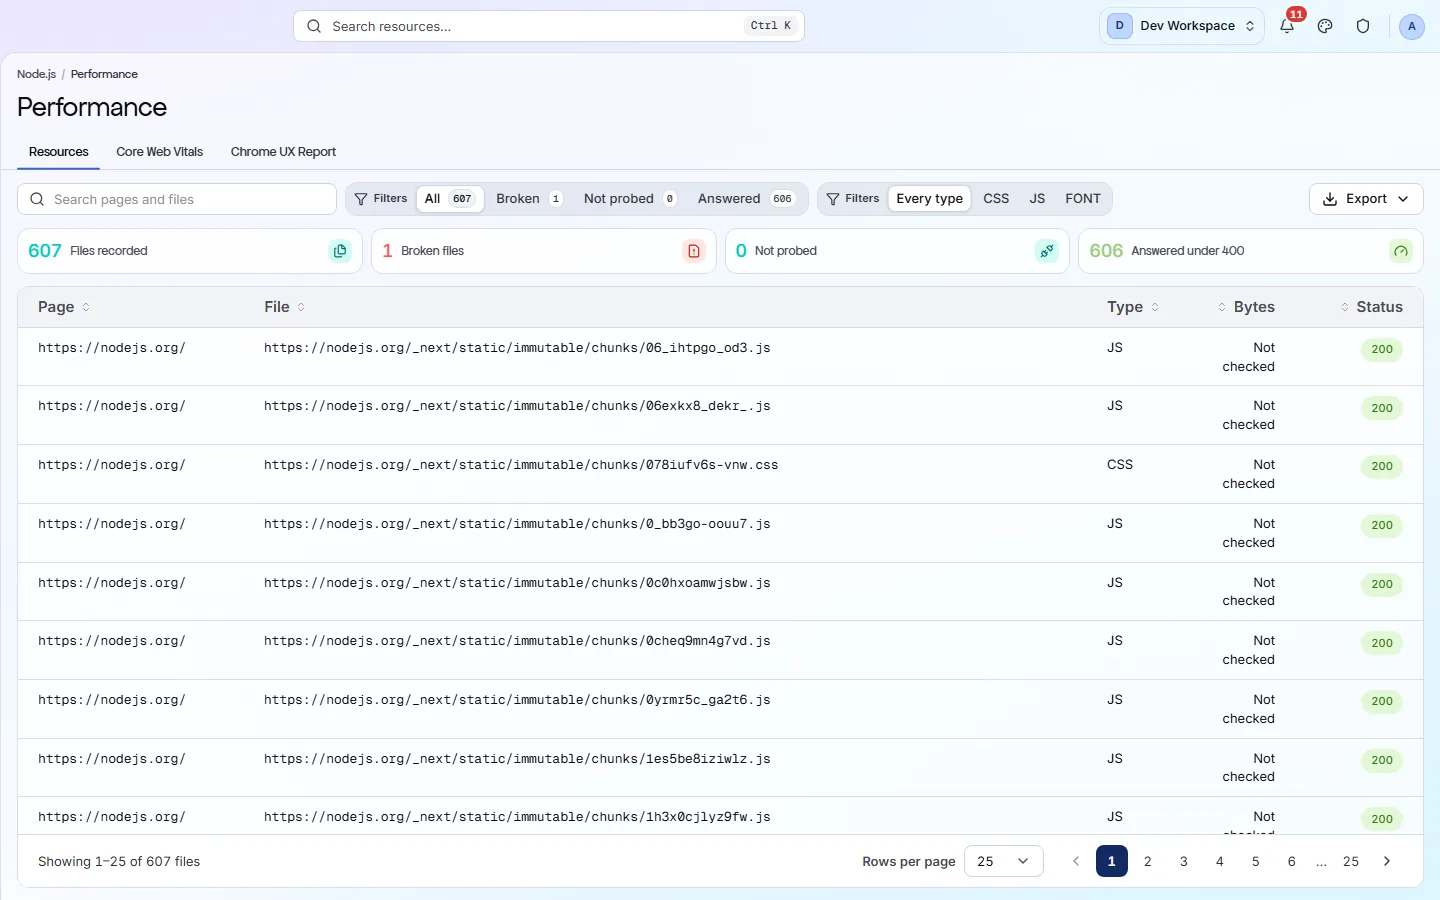
The three tabs#
One comes from the crawl, two come from Google.
| Field | Source | What it does |
|---|---|---|
| Resources | The crawl | Every file each page loads, with its URL, type, size and status. The tiles count files recorded, broken files, files not checked, and files that answered successfully. |
| Core Web Vitals | PageSpeed Insights | LCP, INP, CLS and TTFB for each page, rated against Google's own thresholds. Measured in a lab, sampled each scan. |
| Chrome UX Report | CrUX | Real measurements from Chrome users, where Google has enough of them. A site with little traffic will have none, which is normal. |
If everything says Not measured#
The API key is missing, not your site.
Vitals need a PageSpeed API key
Reading the Resources table#
Each row is one file on one page.
A shared bundle appears once for every page that loads it. Sort by size to find files worth splitting, or filter by type to see how much JavaScript you are shipping. Any status other than 200 is a file the browser asked for and did not get.
Nothing here affects the score directly
If the product does not match this page, the page is wrong and we would like to know. Tell us