Product · Explore
How the site is actually shaped
How many pages, in how many sections, how deep and how heavy — then a treemap, a hierarchy diagram and a tree behind the tabs. The shape of a site is the fastest way to spot a section nobody meant to publish.
What it answers
The questions this screen exists for
If none of these is a question you have, this is not the lens you want — one of the other ten probably is.
- 01Which sections carry most of the site's weight?
- 02How much of it is more than three clicks from the homepage?
- 03Is there a section here nobody meant to publish?
- 04What links to what?
On the screen
What you actually get
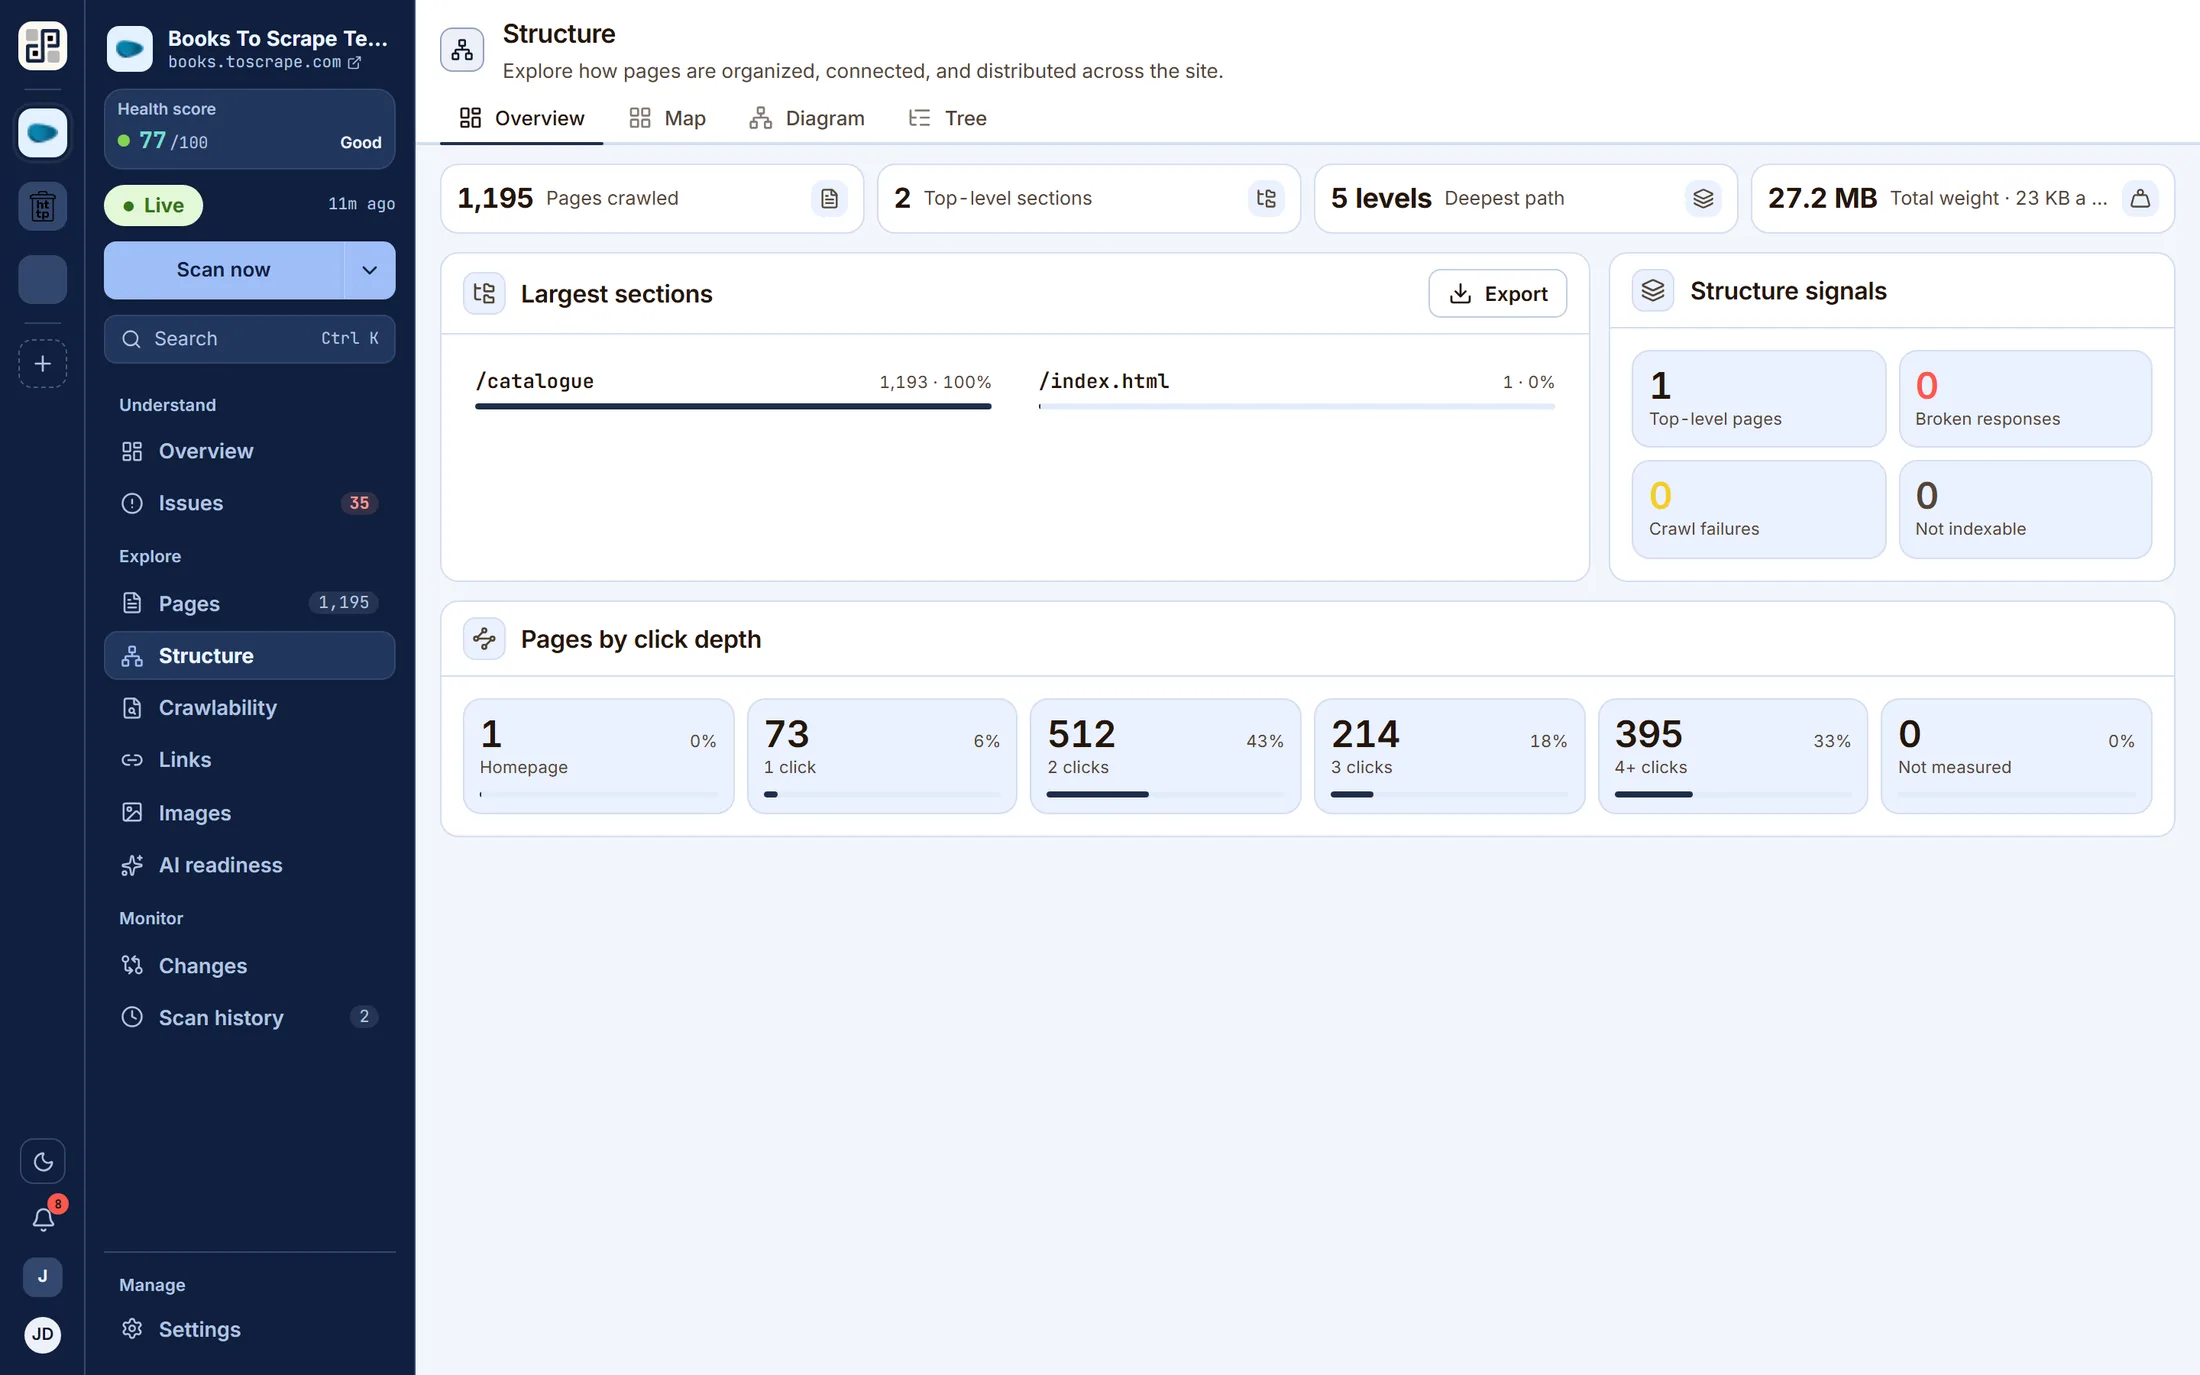
Four things, each of which is visible in the capture above.
Largest sections, deepest path, total weight and average page size across the crawl.
Click depth distribution, because depth is the cheapest proxy for what gets crawled.
Structure signals — top-level pages, broken responses, crawl failures, not-indexable.
Largest sections by page count, so a section nobody meant to publish shows up by size.
Behind it
The checks that feed this screen
Every finding on this lens comes from a check in the catalogue — and every one of those carries a written guide to putting it right, rendered beside the finding in the product.
The other lenses
One crawl, eleven readings of it
They are not separate scans. Each of these is the same dataset asked a different question.
See Structure against your own site
Connect one site free and run a crawl. Every lens on this page fills with your own pages within a few minutes.
Free plan · 1 site · 500 URLs a month · all 100+ checks · no card