

Find out the day a deploy breaks something
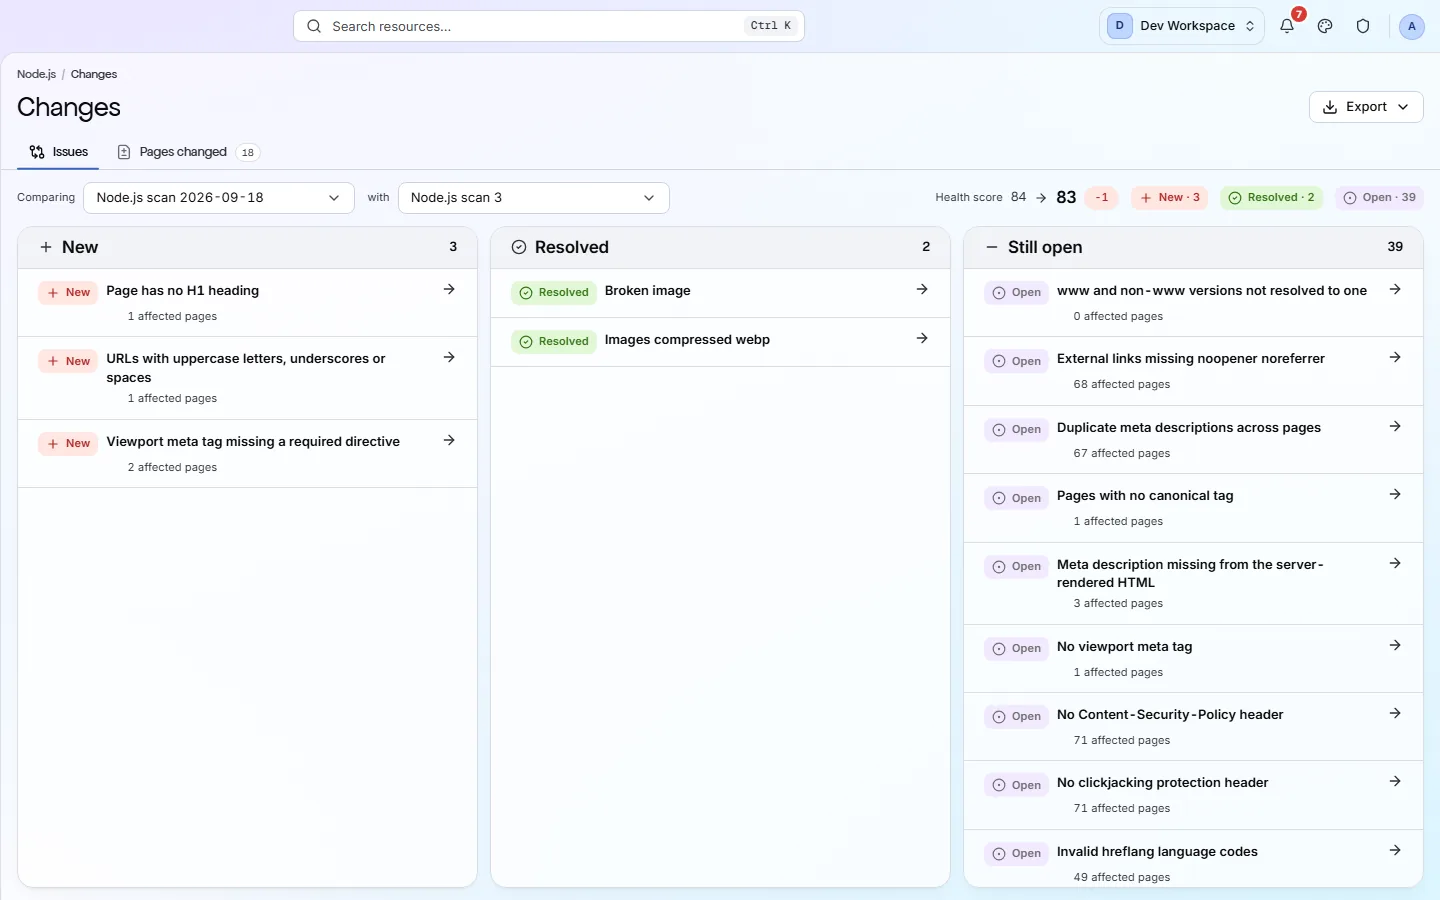
This is the thing the product was built for. Everything else describes a site; this describes a change, and a change is the only version of the question anyone can act on.
If any two of these are true, this page is for you
None of them is unusual. They are what happens to a site that ships regularly and is only ever looked at deliberately.
- Traffic dropped in April and the cause was a release in February.
- Nothing in the pipeline knows or cares whether the page is still indexable.
- A rollback restored the bug because nobody knew which release introduced it.
- Scanning staging and production together makes both sets of numbers meaningless.
What PixyScan does
3 things, specifically
Each one is a mechanism in the running product, not a positioning statement.
- 01
Scan-to-scan diff, per branch
New, resolved and still open, comparing this run with the previous one on the same branch. Two hundred findings you already knew about is noise. The same comparison drives the alerts, so a new critical issue reaches your inbox, your Slack channel or your webhook without anyone opening the product.
- 02
A gate in the pipeline
One CLI command against the branch's environment URL, and an exit code your build can act on. A release that would have broken something does not reach production.
- 03
History you can go back into
Every run keeps its own report - score, failures, pages, branch. Open the run before the one that broke something and read the site as it was that day.
How it fits your week
Day one, then every week after
When you would actually open it. A tool you have to remember is a tool that gets forgotten, so most of this runs without you.
- Step 1
Day one: the baseline and the threshold
Run the first scan on production and set the site's score threshold to what it scored. Put it on a daily schedule if you deploy daily, weekly otherwise. Map your branches if a pipeline will scan previews.
- Step 2
Every deploy: the diff against the run before
The next scan after a deploy is compared with the last one on the same branch. New is what the release broke, and the alert goes out on it - an email to the site's members, a Slack message, or a JSON webhook into whatever you run - for a score that decreased or a new critical issue. Each new finding links to its URLs, which is usually enough to name the commit.
- Step 3
When something goes wrong: walk back through history
Open Scan history and step back through runs until the check passed. The run after that one carries the branch and the time of the change, and its report shows the site as it was, so a rollback restores the right thing.
Worth knowing
- Daily, weekly or monthly schedules per site, in your own timezone.
- Email, a Slack incoming webhook or a generic JSON webhook on scan completed, scan failed, score decreased and a new critical issue.
- A score threshold per site, shared by the in-app threshold alert and the CI gate.
- Branch and environment recorded per run, so a CI scan is identifiable as one.
What it will not do for you
- Four events leave the product - scan completed, scan failed, score decreased, new critical issue. There is no alert for one named check, and no on-call rotation, escalation or paging.
- No GitHub app commenting on pull requests or blocking merges.
- The default CI threshold of 97 is higher than most real sites score. Set your own.
Above the signup button on purpose
What is different four weeks later
Each of these is something you could check, not something you would have to take on trust.
- A release that breaks indexability is known about the same day, with the finding and its URLs.
- A rollback is made to a run you can read, rather than to a guess about which release introduced the bug.
- Staging and production have separate histories, so neither set of numbers is polluted by the other.
- The threshold that raises an alert is the same one the pipeline gates on, so the two never disagree.
Before you ask
Things people in your position ask first
Plans, edges, and the honest answer to the question this page is most often found by.
How quickly after a deploy will I know?
At the next scheduled run, or immediately if the pipeline scans on deploy. A scan of a few hundred pages usually completes in minutes, and the alert goes out when it does - email, Slack or webhook, and the bell inside the product.
Can it tell me which commit did it?
It tells you which run the finding first appeared in, the branch, the time and the URLs. Matching that to a commit is a job for your deploy log, and the time window is usually narrow enough to make it a short one.
Will it page me?
Not a pager, but it does leave the product. Four events go out by email to the site's members, to a Slack incoming webhook, or to a generic JSON webhook: scan completed, scan failed, score decreased, and a new critical issue. Point the JSON webhook at whatever you already page from. Every email carries a one-click unsubscribe, and a pipeline that fails on exit code 1 is still the fastest way to make a regression interrupt someone.
The screens and capabilities behind this
See what is actually on your site
Point PixyScan at a URL and read the first report in a few minutes. The free plan covers one site and 500 URLs a month - enough to find out whether any of this is true.
No card required · 500 URLs a month on the free plan